Grafana Alerts and ServiceNow Event Management
Summary
Grafana is both a log/metric visualization tool and an alerting tool. It can be configured to send its alert data to ServiceNow Event Management, including the ability to auto clear Alerts when Events are updated. This also does not require the special Grafana developed integration for ServiceNow, which requires Grafana Enterprise licensing.
Other notable points
- For Grafana to capture metric data it comonly uses prometheus
- For Grafana to capture log data, you can use loki (similar to Elastic Search)
Setting up ServiceNow to consume Grafana Alerts
- Install Event Management Core/sn_em_ai plugin
- Install the Event Management Connectors/sn_em_connector plugin
- Create at least 1 service account that grafana will use to authenticate to ServiceNow. It needs the role = evt_mgmt_integration
If you need to add multiple Grafana instances you can use the sn_em_connector_push_instance table to register each instance. This will provide you with a special URL to post the alerts for the instance.
Installing kube-prometheus-stack on K3s
The kube-prometheus-stack on K3s offers a quick way to run Grafana in a way that we can do some sample testing.
- Install K3s
sudo curl -sfL https://get.k3s.io | K3S_KUBECONFIG_MODE="644" sh - - Update the startup daemon to make sqllite metrics available
echo "--etcd-expose-metrics=true" | sudo tee -a /etc/systemd/system/k3s.service systemctl restart k3s systemctl daemon-reload - Add Helm repo
#install helm export KUBECONFIG=/etc/rancher/k3s/k3s.yaml curl https://raw.githubusercontent.com/helm/helm/main/scripts/get-helm-3 > install-helm.sh chmod u+x install-helm.sh ./install-helm.sh helm repo add prometheus-community https://prometheus-community.github.io/helm-charts - Create namespace
kubectl create namespace monitoring - Install kube-prometheus-stack. THIS WILL BE NON-PERSISTENT INSTALL
export KUBECONFIG=/etc/rancher/k3s/k3s.yaml helm install kube-prometheus-stack prometheus-community/kube-prometheus-stack --namespace monitoring - Set port forwarding
grafanapod=`kubectl get pods --selector=app.kubernetes.io/name=grafana -o custom-columns=:metadata.name --no-headers=true -n monitoring` kubectl port-forward -n monitoring $grafanapod 52222:3000 --address 0.0.0.0 - Login to http://hostname:52222 with default username = admin, password = prom-operator
Configure Grafana Connection to ServiceNow
https://docs.servicenow.com/csh?topicname=grafana-events-integration.html&version=latest
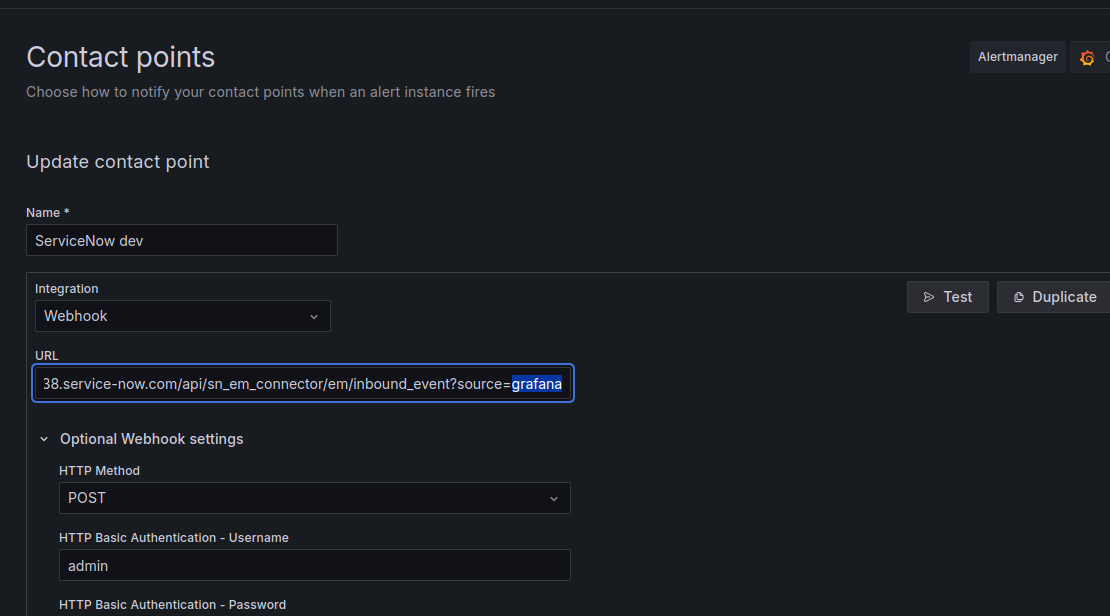
In the Grafana UI, Open Alerting –> Contact Points
- Name: ServiceNow instance 123
- Integration: Webhook
- URL: https://instance-name.service-now.com/api/sn_em_connector/em/inbound_event?source=grafana
- HTTP METHOD: POST
- USERNAME: ServiceNow account with evt_mgmt_integration role
- PASSWORD: for the account above
Click test and sure a 200 response. An event and alert should be created.

Configure Grafana Alert Rule to trigger to the contact point
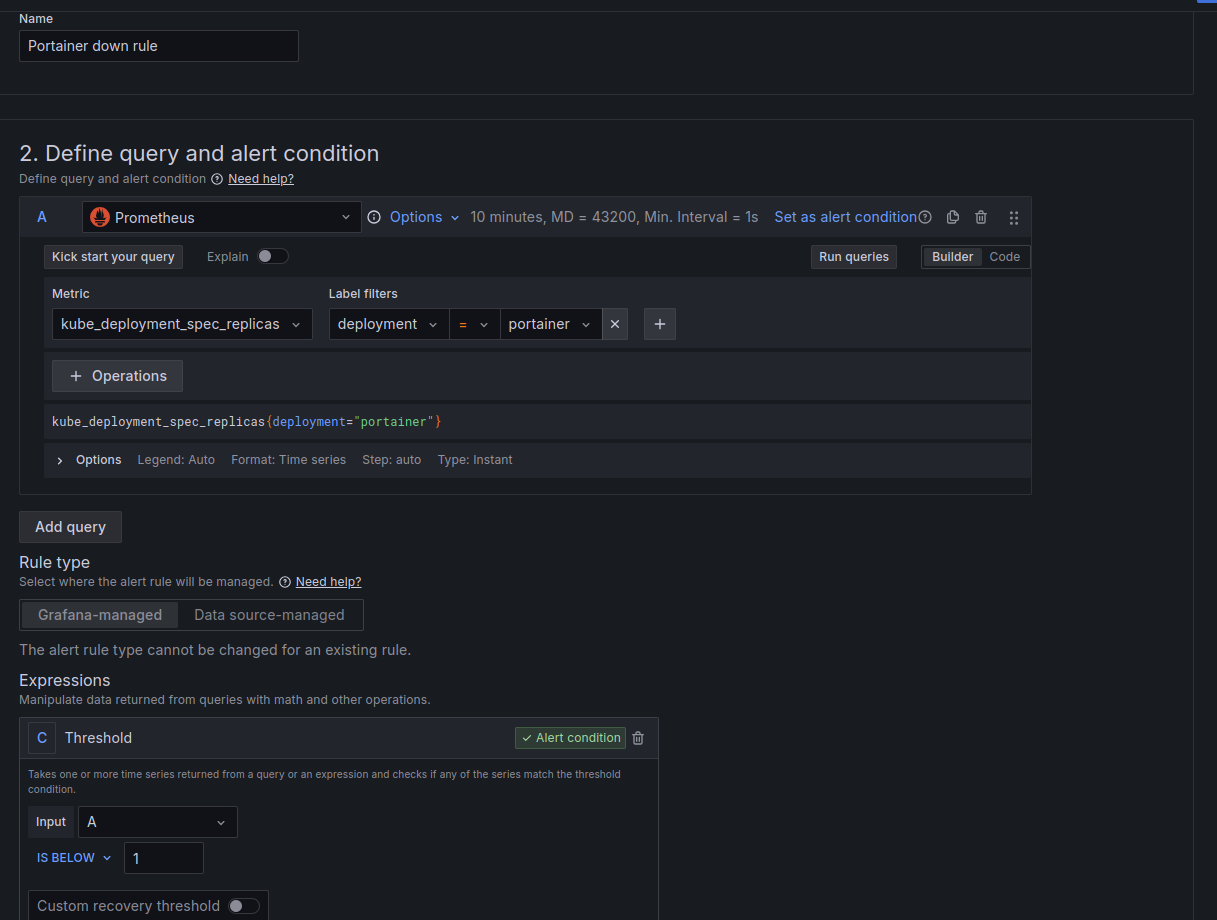
I’ve added a portainer deployment to the K3s server. We can be build an alert rule to detect when it is down. See screen show below for an example. Once created we can mimic an outage by scaling the portainer deployment down.
kubectl scale -n portainer --replicas=0 deployment/portainer

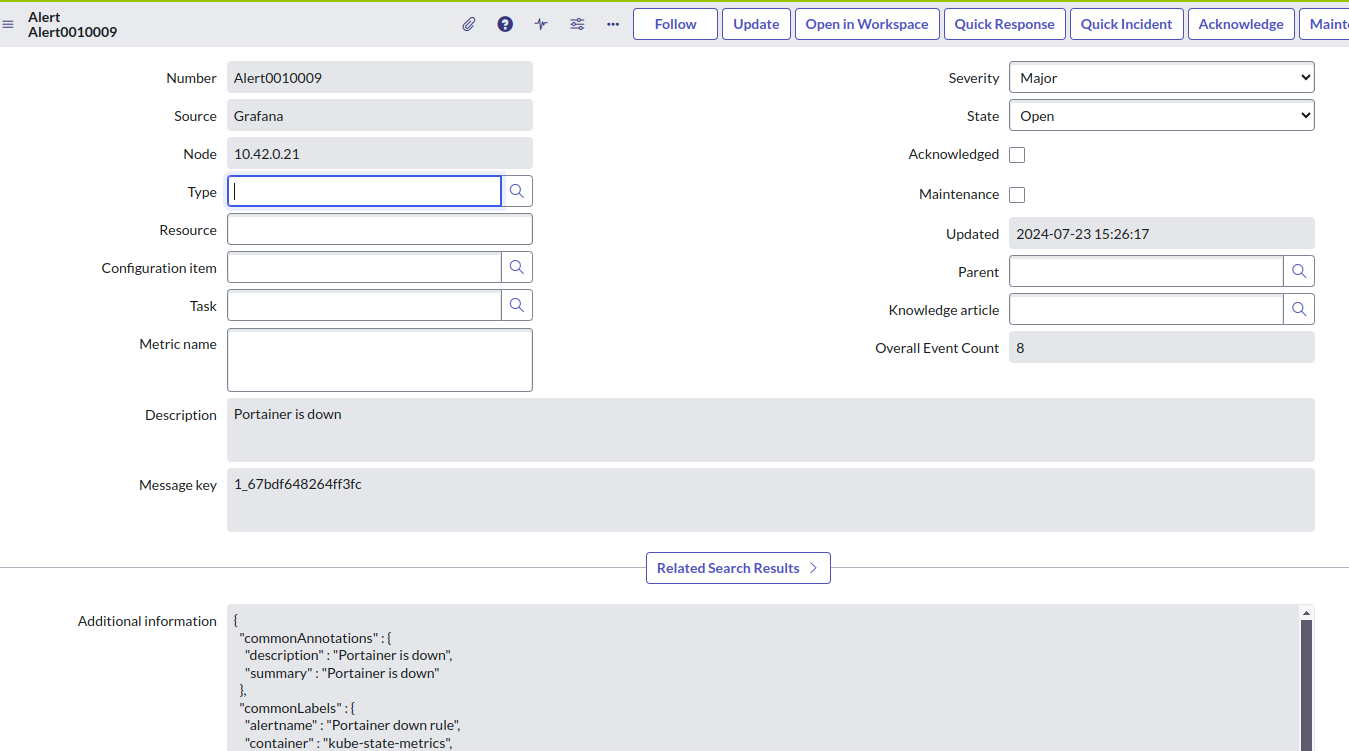
Result in ServiceNow

Leave a comment